YOU CAN’T IMPROVE WHAT YOU DON’T MEASURE
REQUEST DEMO
The Reporting Dashboard is a convenient, easy way to organize the most frequently used reports and display insights and charts generated for real-time performance and data visuals. Each customized Dashboard is unique to the user-id that is logged into Realtrac for easy access on any computer being used.

The Reporting Center is pre-filled with standard industry reports. However, this robust system allows you to customize your reports as necessary to make decisions based on real-time data and business conditions. (Image 1.1)
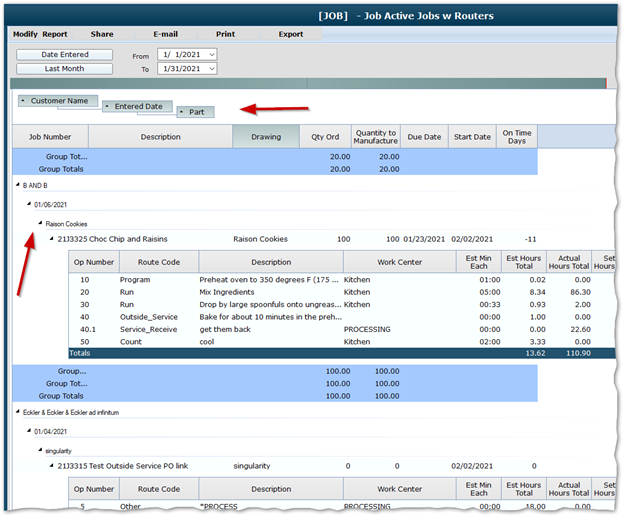
The filters and columns editor window will automatically open to create the columns and filters desired. Upon completion of building your report, you will then have the option to further customize by grouping by specific categories, i.e. part #, customer, month, etc. (Image 1.2)
Rounding out the customization screens, you have additional drill-down capabilities. This allows you to drill into the underlying data of what is being represented without changing screens. Each report will have varying drill-down data fields based on availability. (Image 1.3)


Realtrac insights metrics are intended to help monitor current operations and business performance that assist in achieving your business goals. With the available charts and real-time widgets, you can customize and build a Dashboard to analyze situations, departments, profits and more.
Sampling of available charts


